An affordable, easy-to-use sensor monitoring solution to measure your water quality and document your measured results. Depending on your process operations, you can select which measurements are important and start simply with sampling and recording a few parameters. The data will indicate whether your processes are stable and repeatable or if unexpected variability is being detected. Based on your evaluation and analysis of the measured data, you can determine if continued monitoring is necessary or other corrective actions required. The Intell-i-Watch monitor can then be tasked with monitoring other water quality parameters in order to obtain a better understanding of process repeatability.
What Does the Intell-i-Watch Provide to See the Sensor Data?
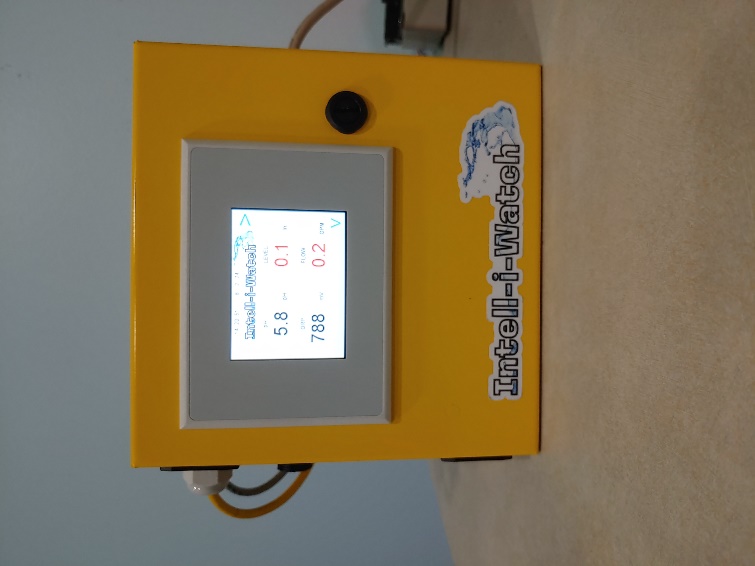
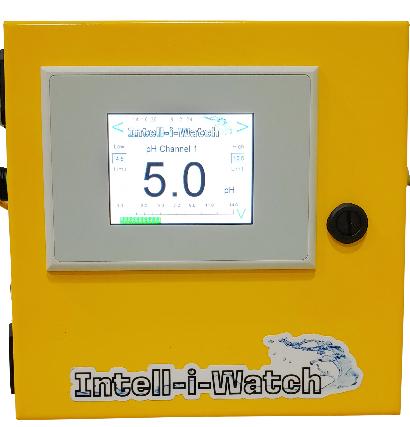
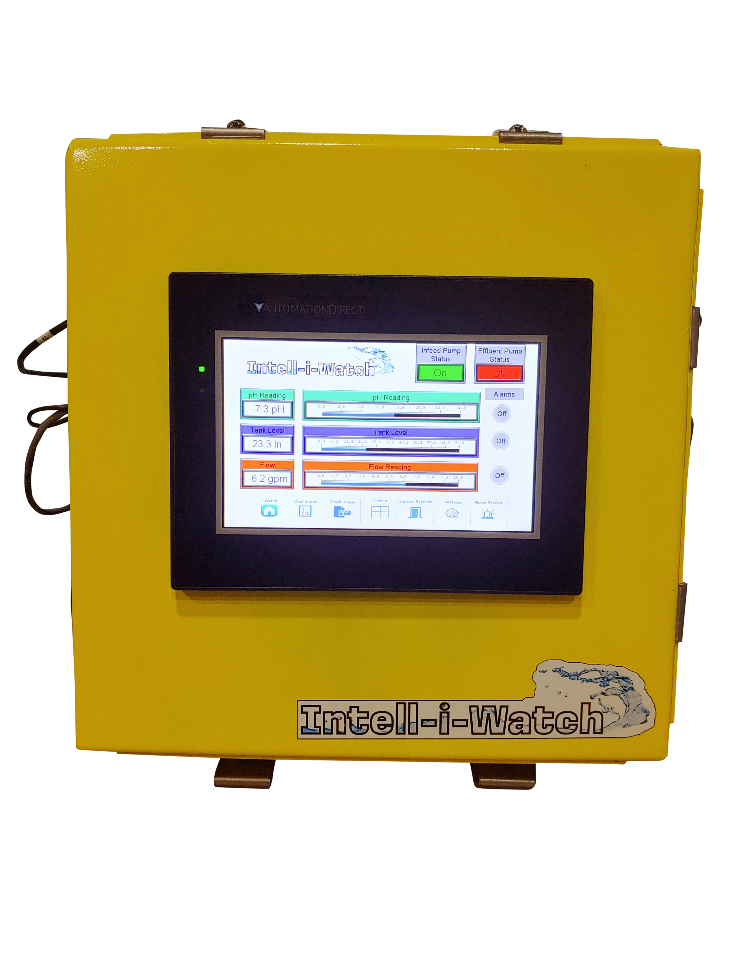
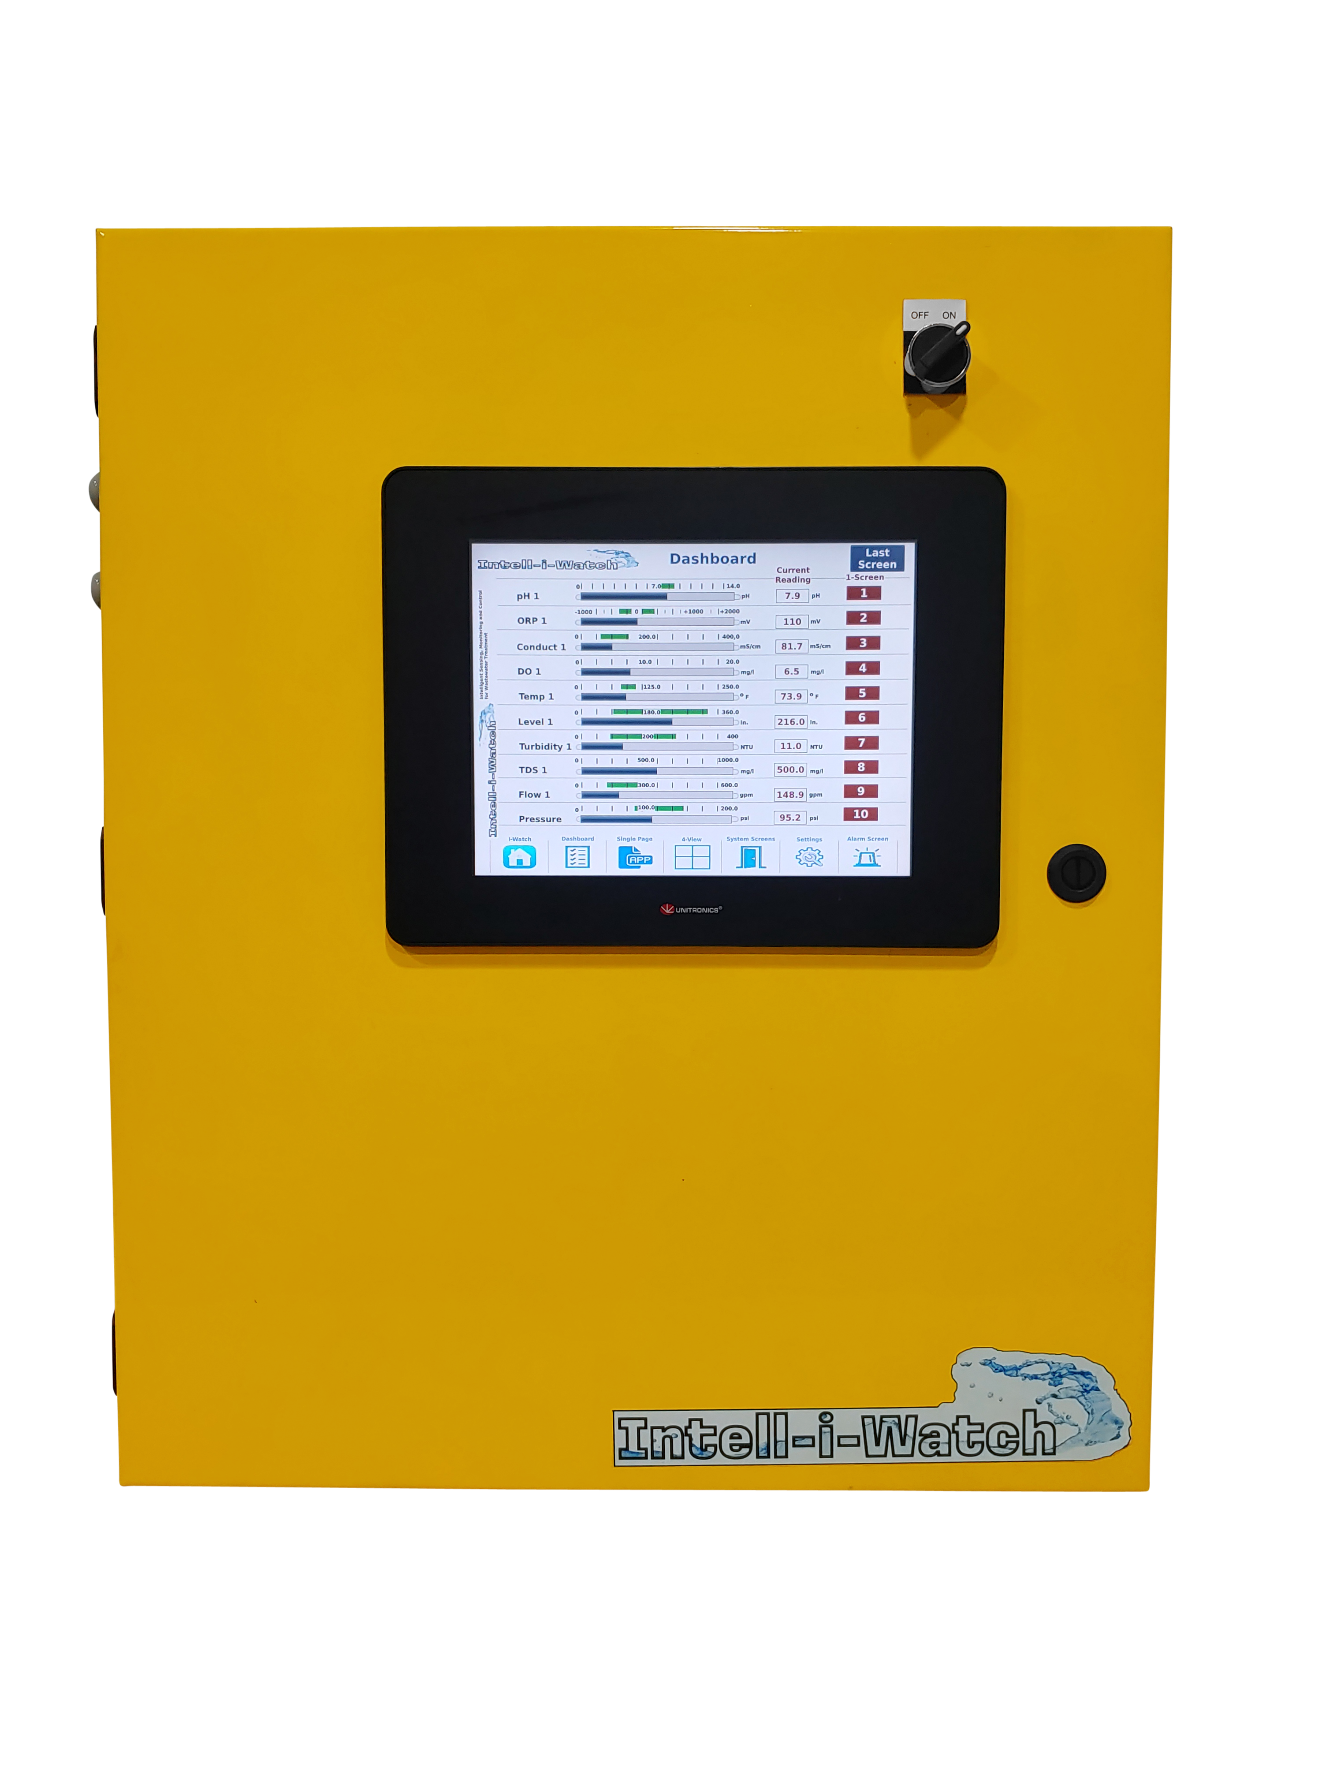
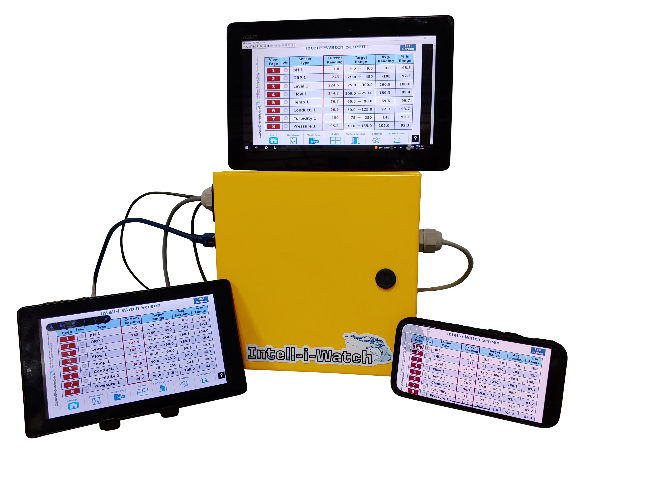
Each model of the Intell-i-Watch family provides multiple screens that can be accessed and viewed for the sensor inputs being monitored. The screens will display real time values, acceptable range limits, alarm setpoints, historical logged data trends, period averages and statistical measures for each monitored sensor input. There are also help screens that provide information for operation usage and training.
Intell-i-Watch models can operate independently of any outside connections – network, internet or remote – and stored data logs can be manually transferred to additional permanent storage devices. Historical data can be accessed on the monitor and viewed as trend graphs with all data logged and date stamped.
The Intell-i-Watch monitor is an integrated visual display and data logging smart tool. Sensor measurements are able to be displayed and viewed in real-time as well as historical trends. The sensor measurements can be recorded at whatever sampling times make sense for the process conditions. For fast changing events, we can record every second or for slow changing events, maybe we record the value every couple of minutes. The Intell-i-Watch monitors each sensor measurement on a real-time basis and calculates rolling averages as well as capturing the minimum and maximum parameters for period statistics. Some of the user screens will display period usage values for month-to-month comparisons as well as alarm logs and time-stamped alarm actions.
Examples of Sensor Data presentation on Intell-i-Watch screens
Shown here is a sampling of the multiple screens able to be accessed and viewed in the Intell-i-Watch monitor.
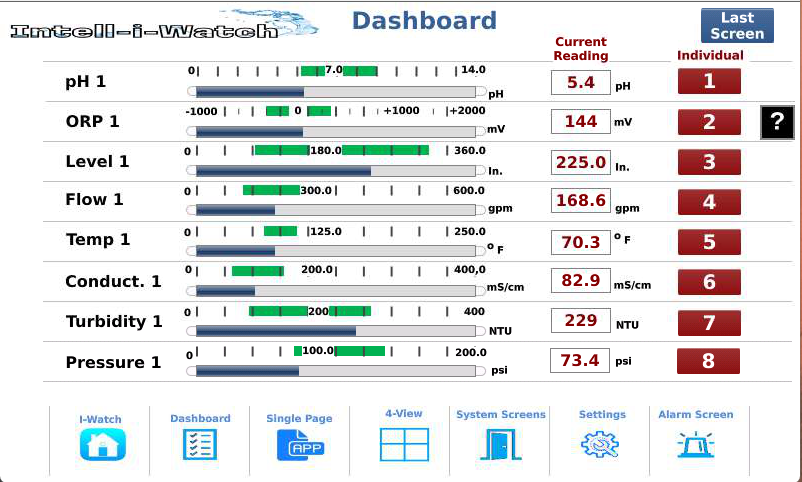
Dashboard screen displays the current measured readings for each sensor in both a numerical and bar graph representation.
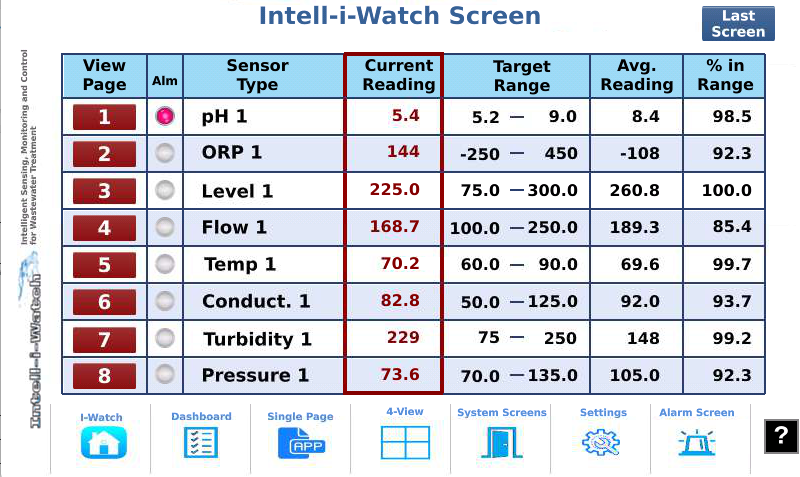
The Intell-i-Watch overview screen displays real-time measured values plus statistical performance measures for each parameter.
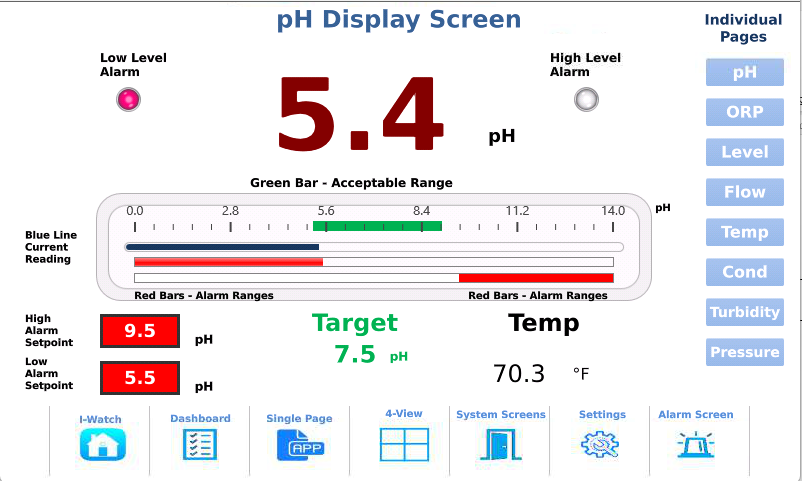
Each sensor has a full-screen display that provides a view of target range, alarm ranges, if alarms are active and specific alarm setpoints.
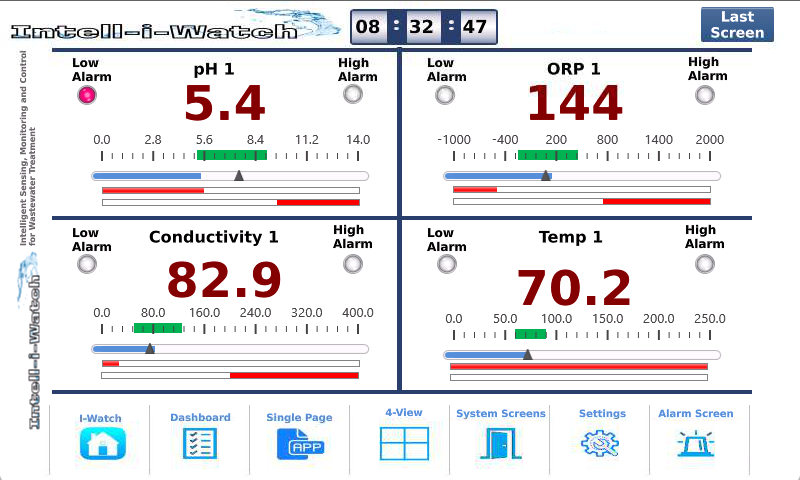
Depending on the monitor’s screen display size, multiple sensor readouts can be displayed in groups such as a 4-View shown above.
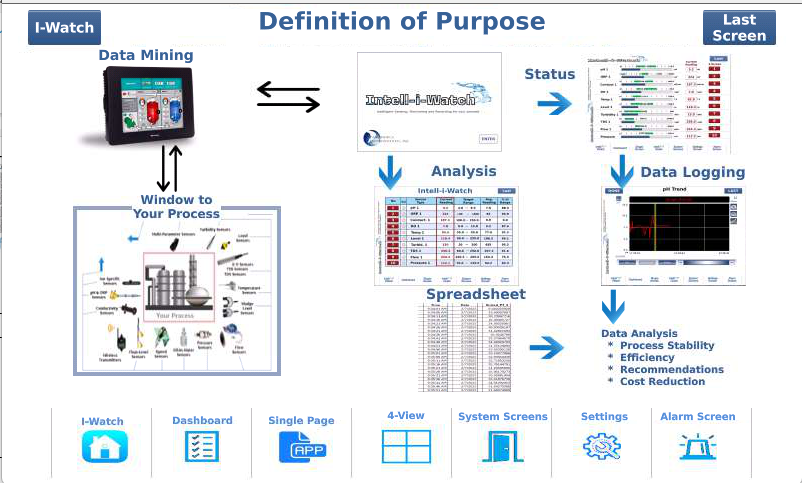
Some of the screens are provided as learning support screens for operators or users. They illustrate that process sensors are connected to the Intell-i-Watch monitor and the purpose of the displaying, recording, and sharing measured sensor data.
On a number of screens above, there are screen help buttons that open up additional notes and explanations of the screen operations.
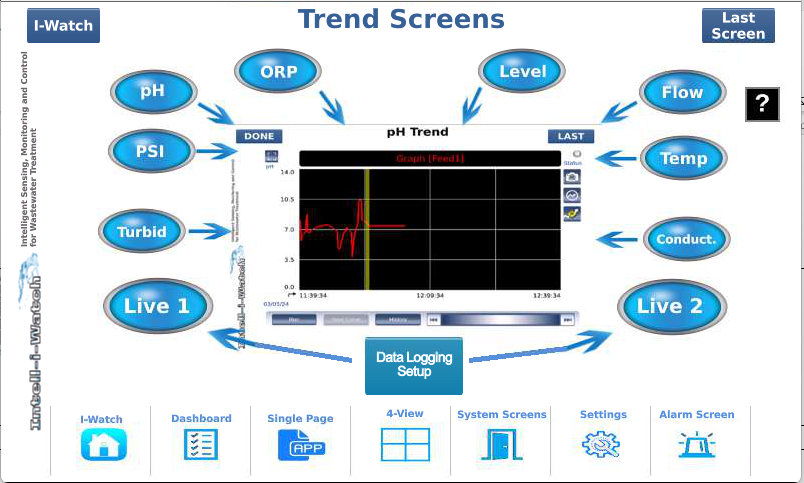
Measured sensor values can be viewed in trend graphs.
 The monitor screen can display historical logged data and trend plots can be captured in a picture image format for further review usage.
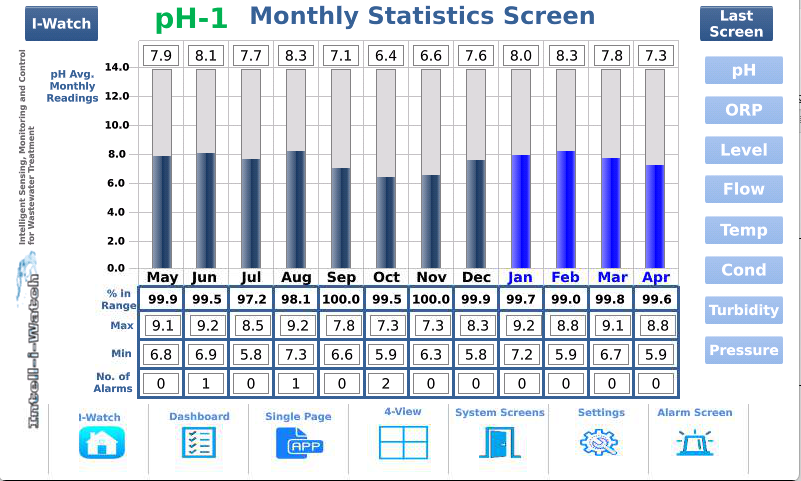
The Intell-i-Watch sensor data is collected and can be compared to past recorded data as shown in a table format.
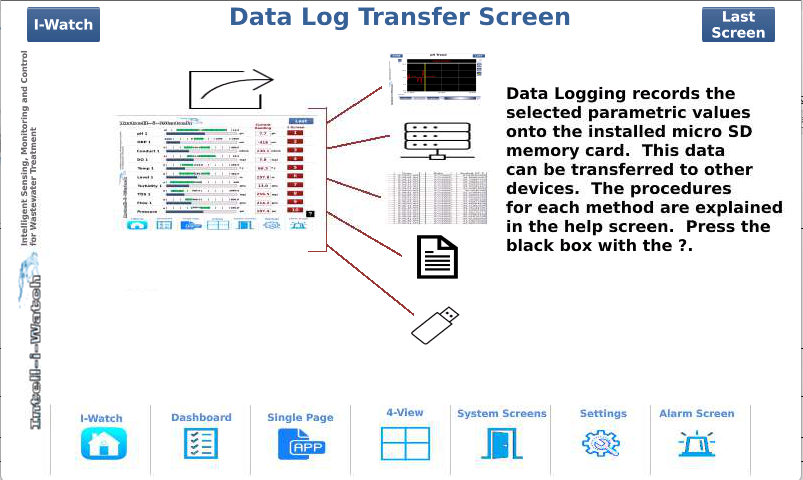
On screen help buttons provide detailed instructions on how to transfer data logs from the Intell-i-Watch memory to be shared with other analytical programs like Microsoft Excel. The data logs which include time and date of the measurements can be exported in CSV file format to other programs and devices. This can be done with the Intell-i-Watch monitor either manually when fully isolated from any connection or automatically if connected to your plant network.
Connections and data sharing
The multi-screen display allows for sensor data to be viewed at the sensor connection box or remotely to other authorized viewports. The Intell-i-Watch products can operate as self-contained data collectors or they can be connected to your plant network for secure access and file transfer sharing of measurement data and compliance records. The monitors have a resident webserver that can be accessed by authorized personnel with proper password access. The monitoring software can provide for alarm annunciation and reporting to plant networks or cellular phone texting. All of these communication capabilities are intended to be approved and authorized by the customer’s IT/OT supervisory personnel. All optional connectivity features are only enabled with customer approval to ensure safe and secure operations. Dashboard displays can be hardened for only internal usage or can be cloud based.
All Intell-i-Watch logged and recorded data can be transferred from the internal memory storage to mobile memory storage devices for importing into spreadsheet programs for further data processing. Data that remains on the monitor's internal storage can be accessed and viewed through the main screen and trend graph displays. Any of this touchscreen display information can also be captured in a snapshot image format and saved internally or transferred to any external image picture software.
Flexible and adaptable
Probably the biggest advantage that the Intell-i-Watch product family is providing is its flexibility and adaptive use features. The design architecture for the Intell-i-Watch is based on its capability to expand the performance it provides to the customer. For each sensor measurement, the customer can define alarm or alert setpoints at any time and change when necessary. In the event of a process shift, alert and alarm setpoints can be easily shifted as well. In the event of process time latencies, alert or alarm events can also be time compensated for process delays. The products also can be adjusted to allow for a different sensor mix or be expanded by additional plug-n-play accessories.
Sensors and applications
Sensors can be almost any standard type of discrete output or analog output transducer. We can monitor processes like industrial wastewater treatment to measure the results from oil-water separators, pH neutralization treatment, metals and salts extraction, or other applications.
Sensors can be used to monitor electrical energy usage or monitor equipment performance to detect potential faults or failures before they occur. For process or mission critical applications, we recommend monitoring temperatures, or parameters that can detect needs for service or maintenance prior to downtime related failures. Part of the Intell-i-Watch monitoring includes elapsed run-time monitoring. When process patterns develop, they can be detected and applied to routine service checks or sensor calibration adjustments or even replacement.
In the tracking of alarms or alerts, if conditions produce repetitive occurring faults, this data would suggest the need for a review of the components for suitability in the application. In some cases, it may be the correct component but just not installed or mounted for optimal service life and performance.
Primary Objectives
- Measure and record process sensor data in order to make value judgement of actual process conditions
- Be able to monitor and compare results to past measurements to detect process changes or the need for sensor calibration services
- A versatile tool that can be adapted to other process monitoring needs. With some processes, upsets or reaction occurrences can be faster than typical data recording rates. The data logging sampling rates can be operator adjusted to detect conditions of stability or unwanted variability
- Data logs can be your source of documented process results to remove uncertainty by having credible measured process information
- By adopting a measure and verify procedure, it provides a useful tool for the operators and plant personnel responsible for the process.
Importance of Sensor Process Measured Data
Sensor measured data can be very important to process performance including out-of-spec alarms and alerts. When the data is captured and compared, the hope is to be assured that the process requirements are being safely and responsibly met.
However, if not, the sensor data can help lead to a cause-and-effect relationship to address any corrective actions. By proactively measuring process variables, we can better document process performance without guesswork or assumptions.
Process validation or verification is not a one-and-done application methodology. It begins with starting in small steps and building knowledge and expertise through good practices and procedures. With each step you learn how to improve with the next step and the next after that.
We believe that the Intell-i-Watch family of products are tools to combine sensor automation with the human skillset of multi-sensor perceptions. We operate as a sensor data concentrator or collector to then present the data for interpretive human analysis. This repetitive process contributes to better informed personnel and ultimately better documented processes.
Pan America Environmental has been engineering and designing industrial wastewater treatment solutions for over three decades.